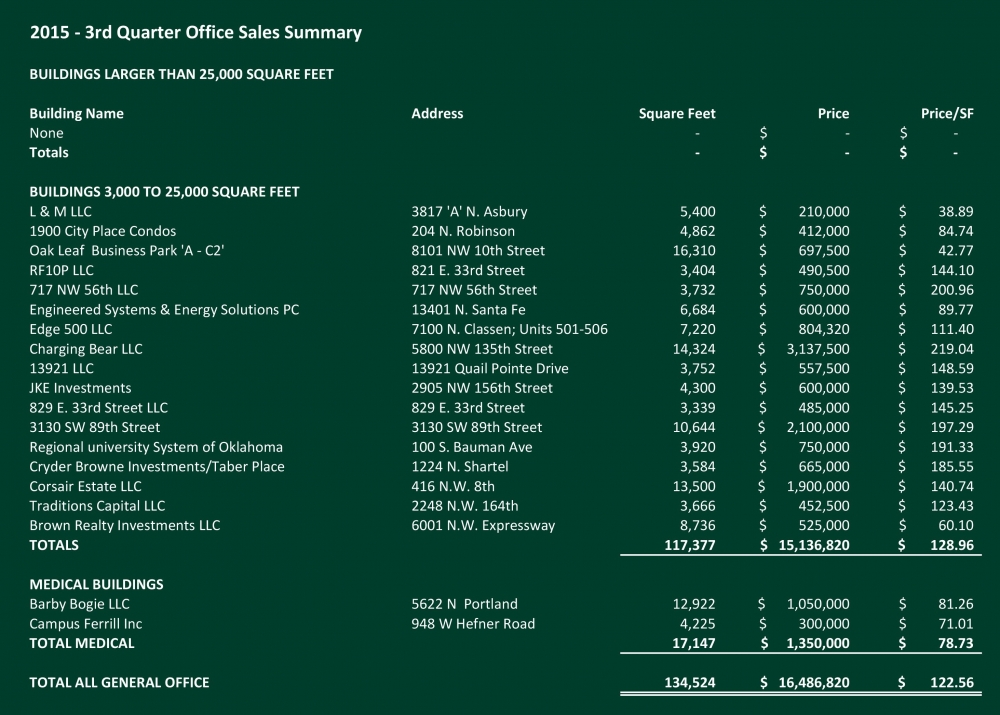
Office Market Sees Slow Sales in Third Quarter
The third quarter has been an interesting one in the Oklahoma City market. Considering the number of large office buildings that are on the market openly and those that are known to be available, there were no sales of office buildings larger than 25,000 square feet in the quarter ending September 30th. This is the first quarter since we started preparing this quarterly analysis in 2013 that no building larger than 25,000 square feet has changed hands. The explanation could be a sign of unfortunate things to come, or it could be an anomaly.
For buildings in the range of 3,000 to 25,000 square feet, there were 16 sales totaling 117,377 square feet at an average price of $128.96 per square foot totaling $15,136,820. Two Medical buildings totaling 17,147 square feet sold in the quarter at an average price of $122.56 per square foot totaling $1,350,000. The number of smaller building sales shows no great difference than sales in other quarters so that segment of the market seems to be holding steady.
Regardless of the diversification of the Oklahoma City economy achieved over the last 20 years, if the 4th quarter of 2015 continues to show signs of slowing in the sales of larger buildings, we may be seeing the signs of the impact of reductions in the prices of commodities in general and oil in particular.
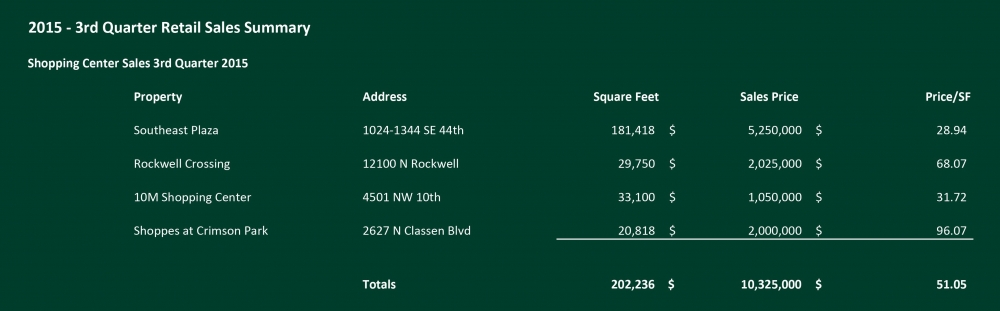
Third Quarter Retail Sales Total $10.3 Million
After $105 million in sales over the first half of the year, led by the $51 million Belle Isle Station sale in May, third quarter sales slowed, totaling $10.3 million. The four sales were comprised of three small strip centers and Southeast Plaza, the older 181,418 square foot center on southeast 44th street. Southeast Plaza, anchored by Buy for Less and Family Dollar, sold for $29 per square foot.
We continue to see significantly more buyers than sellers in the marketplace. Over the past few years, a number of high-profile class-A centers have traded hands as have a number of distressed lower-end centers. And, centers in the 15,000 to 40,000 square foot size of varying quality have sold. However, very few mid-market neighborhood centers are being marketed for sale. We attribute this primarily to investors wanting to maintain their returns and the corresponding lack of favorable investment alternatives for their sale proceeds.
Changes in markets, whether good or bad, typically lead to higher transaction volumes. Given the continued weakness of the energy market and growing concerns about its effect on the real estate market, we anticipate more properties coming onto the market in 2016. Capital should remain available at favorable terms, setting the stage for an active year of investment sales.
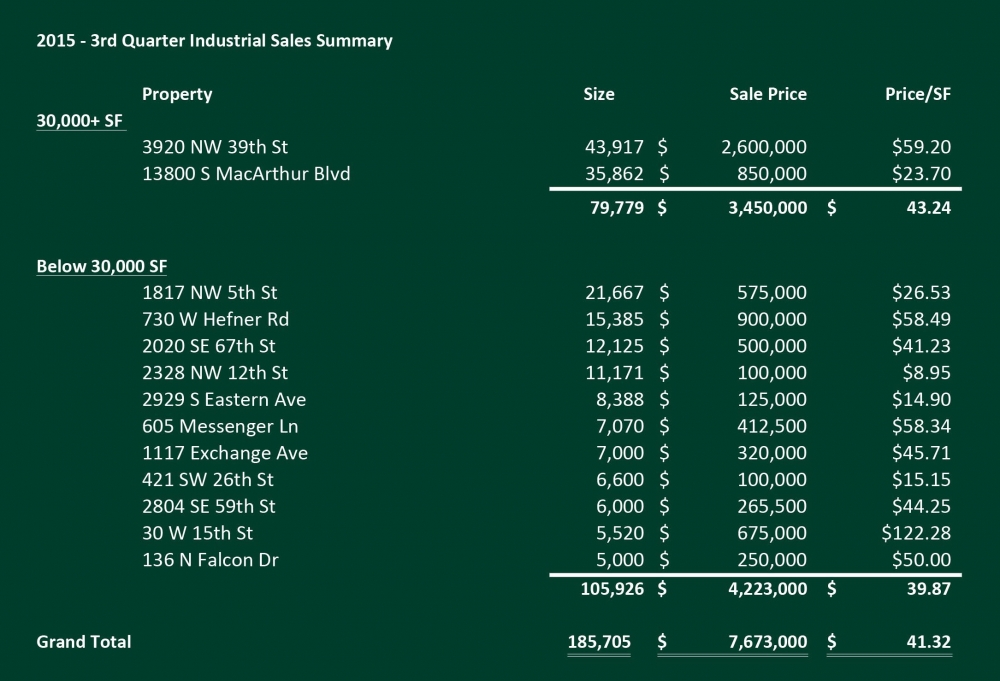
Industrial Market Sales Slow in Third Quarter
From an active 2nd quarter, industrial building sales slowed in the 3rd of 2015. This exhibits more of a true reflection of the OKC industrial market, which is heavily influenced by depressed crude oil pricing. Overall, there were 13 industrial buildings sold containing 185,7075 square feet for a total consideration of $7,673,000. The market-wide average price per square foot in the 3rd quarter was $41.32, which is a 30% increase over the 2nd quarter. Although, the price per square foot increased dramatically; it’s a derivative of the relatively low price of the Macklanburg-Duncan transaction which sold in the 2nd quarter.
All things considered, the Oklahoma City industrial real estate market has stabilized compared to the 2nd quarter. During 2014 the total market vacancy rate declined steadily from 6.8% to 5.8% at year-end. Through three quarters of the present year, the vacancy rate has remained level at 6.2%. These low availabilities will continue to support the growth we have seen in rental rates, although leasing velocity lacks last year’s momentum due to product availability.
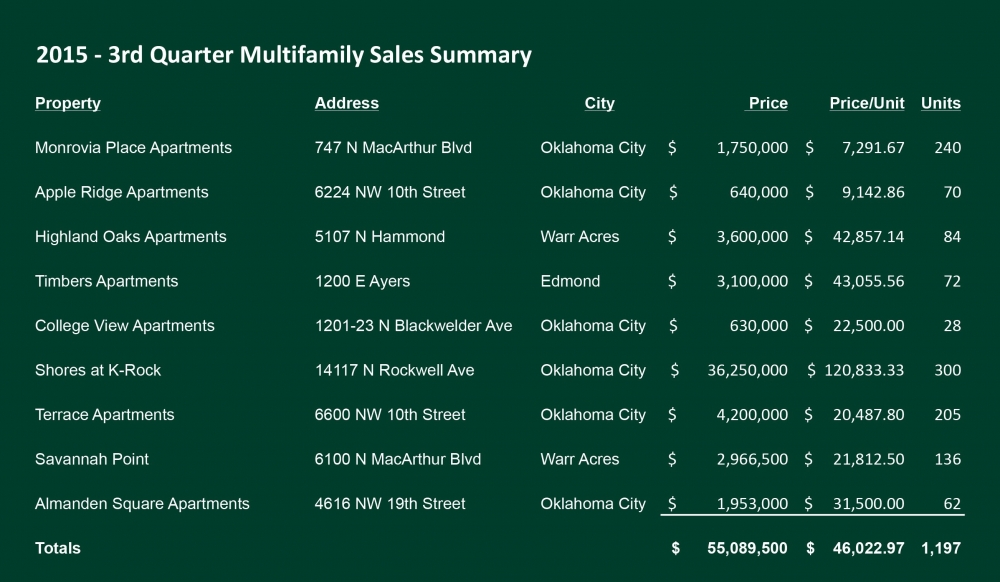
Multifamily Sees Active Third Quarter by Historical Measures
In the third quarter of 2015, the Oklahoma City multifamily market was very active by historical measures, but not as active as the previous quarter or the third quarter of 2014. The third quarter of 2015 totaled nine transactions totaling 1,197 units accounting for a volume of $55,089,500. This is 38% below the previous quarter and 33% below the same quarter in 2014. The average price per unit is slightly up from the previous quarter by 9% coming in at $46,023 per unit; however, this is down 14% from the same quarter of 2014. Year to date is relatively the same as the end of the third quarter in 2014 with a total of 4,578 units trading hands accounting for a volume of $192,272,761, up 5% from the same time last year. At the end of the third quarter, the average price per unit is $41,999 which is a slight decline of 5% for the same time last year.
Breaking the transactions down by class shows a shift in where buyers are active in the market compared to last year. Class A remained relatively slow similar to 2014 with only one transaction happening year to date for 2015. The $36.25 million dollar transaction of the Shores at K-Rock traded for $120,833 per unit 5% above the single Class A transaction the same time last year, Liberty Pointe. Class B volume decreased dramatically with only 398 units totaling $22,650,011 trading so far in 2015, down a staggering 80% and 73% respectively compared to the same time last year. Although the volume was down, the average price per unit for B Class assets increased 37% to $56,910. One large reason for this was a portfolio sale in 2014 that artificially decreased the price of Class B assets. Excluding those assets, the average price at the end of the third quarter for Class B units would have been $53,459 which accounts for only a 6% increase in value year over year and a more realistic view of the market.
Class C properties picked up the slack created in the B Class decline with a total of 3,541 units trading hands, which is twice as many as traded in 2014. The total volume was up 114% to a running total of $130,782,750 at the end of the third quarter, giving an average price per unit of $36,934. If you removed the non-performing C Class assets the average price per unit for stabilized properties is $39,949, up 11% compared to $35,859 the same time period last year. 2014 had no D Class transactions, while year to date we have had three totaling $2,590,000. The D Class average is $7,640 per unit, keeping in mind these are properties that are significantly damaged and distressed and not the typical non-performing C Class asset.
What does all this mean? Although the market is still strong it doesn’t show the momentum upwards like we experienced going into 2015. Appetite is still strong, but the growing concerns of energy prices and interest rate changes have left many investors thinking a little more before acting. Transactions in the pipeline are still happening, but bidding wars once flared up have started to dampen a little. This doesn’t mean we are headed into a downturn; it just means investors aren’t willing to continue piling on. Going forward, properties with strong operating history will continue to sell; buyers will underwrite a little more conservatively, but still pushing rents some. Class A will continue to sell when they come to market, with Class C feeling the most pressure on pricing. The final quarter will end strong but the year will likely end up similar to 2014.
The data shows that with the lack of distressed properties, and the soaring average prices per unit paid, the market is very robust and stabilized properties are in demand. The most active buyers are regional and national value-add investors picking up stabilized Class C assets looking to increase the properties yield from implementing upgrades and management changes. This is very similar to what the same situation was in the mid-2000’s, however, the buyers of today are slightly more conservative with their projections than they were in that same time period. The lack of Class A transactions is not for a lack of buyers, rather it’s a lack of inventory. We expect to see some transactions over the next twelve to eighteen months as a few new projects near completion and are brought to market. For now, all eyes are on interest rates to determine how long this market expansion will last.