Office Division

Cordell Brown, CCIM, CIPS
Office Investment Specialist
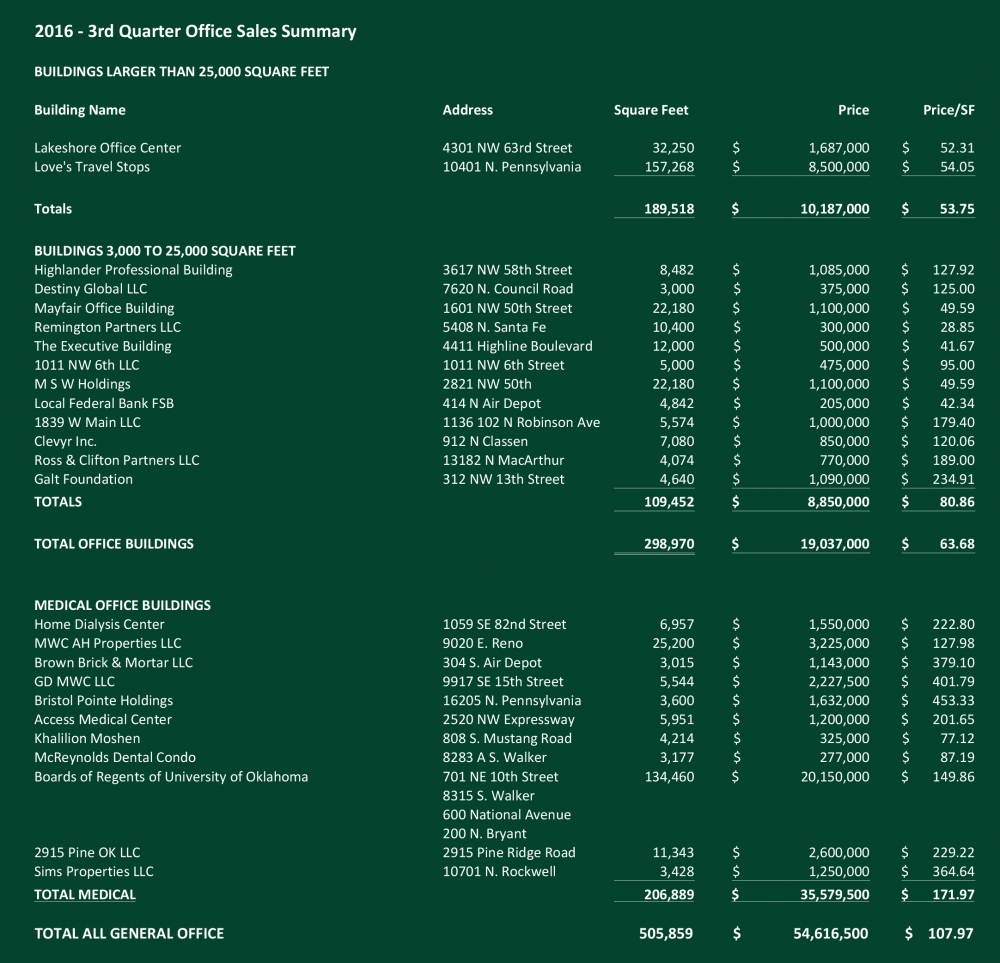
Medical Office Sales Show Tremendous Growth
The 3rd Quarter of the year saw lackluster activity in the sale of office buildings in the 25,000 square feet and larger range. The purchase of the former Hertz Reservation Center was the only major sale. That sale came as no real surprise given the proximity of the approximately 157,000 square foot building to Love’s headquarters and the continued growth of the firm. The sale price of $8,500,000 ($54.05 per square foot) was very reasonable and left plenty of room for upgrades when compared to the cost of new construction. The other sale was an older, well located suburban office building that sold in the $50 per square foot range.
The mid-range building sales of 3,000 to 25,000 square foot buildings shows the diversity of the Oklahoma City office market. Of the 12 sales in this category seven of the buildings ranged from $95 per square foot to just under $235 per square foot. The remaining six buildings all sold for less than $50 per square foot. This disparity led to the sale of 109,452 square feet of office properties for an average of $80.86 per square foot. The total of all sales in the mid-range buildings was $8,850,000. The remodeling and renovation contractors should have a nice fourth quarter.
Medical office sales were a vibrant part of the office sales in this quarter. A total of 14 buildings containing a total of 206,889 square feet sold for $35,579,500 for an average price of $171.97 per square foot. The most notable sale was the purchase of all four of the Oklahoma Clinic buildings containing a total of 134,460 square feet by the Board of Regents of the University of Oklahoma for $20,150,000 or $149.86 per square foot. No plans for the buildings have been announced. Also, we have seen excellent activity in the sale of urgent care clinics. Several of the sales were to out of state investors acquiring clinics owned by established corporate operators leasing back the operations of the clinics.
Total sales for the 3rd Quarter were 505,859 square feet of space for a total of $54,616,500 at an average price of $107.97 per square foot.
Retail Division
Paul Ravencraft, George Williams, Phillip Mazaheri, CCIM
Retail Investment Specialists
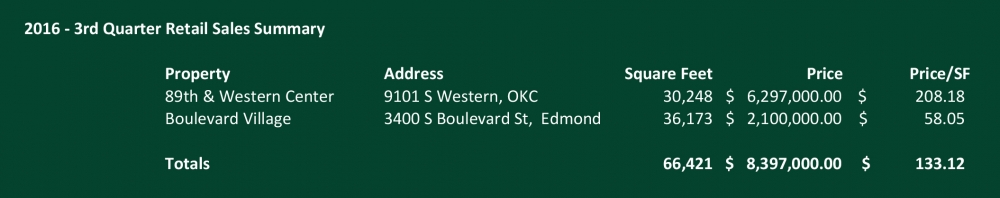
Retail Market Continues to Slow With Sales
Retail investment sales volume remained slow in the third quarter with the sale of two small strip centers, Summit Pointe Plaza & Boulevard Village, totaling 30,248 square feet & 36,173 square feet respectively. The lack of available product continues to limit sales despite significant buyer interest. We see this trend continuing for locally owned property, but there is beginning to be movement in the institutionally owned property market. Quail Springs Marketplace and 240 Penn Park, both large quality power centers, are being marketed for sale. What's interesting is that national REITS, which have been the buyer of the last several such properties in our market, appear to be staying on the sidelines, keeping their acquisition focus on their primary large-city markets. Consequently, the properties, if they trade, are expected to trade at a somewhat higher capitalization rate, putting them in play for private national/regional firms as well as local investors.
Industrial Divison

Danny Rivera, Mark Patton, Bob Puckett, Chris Roberts
Industrial Investment Specialists
Industrial Market Shows Momentum
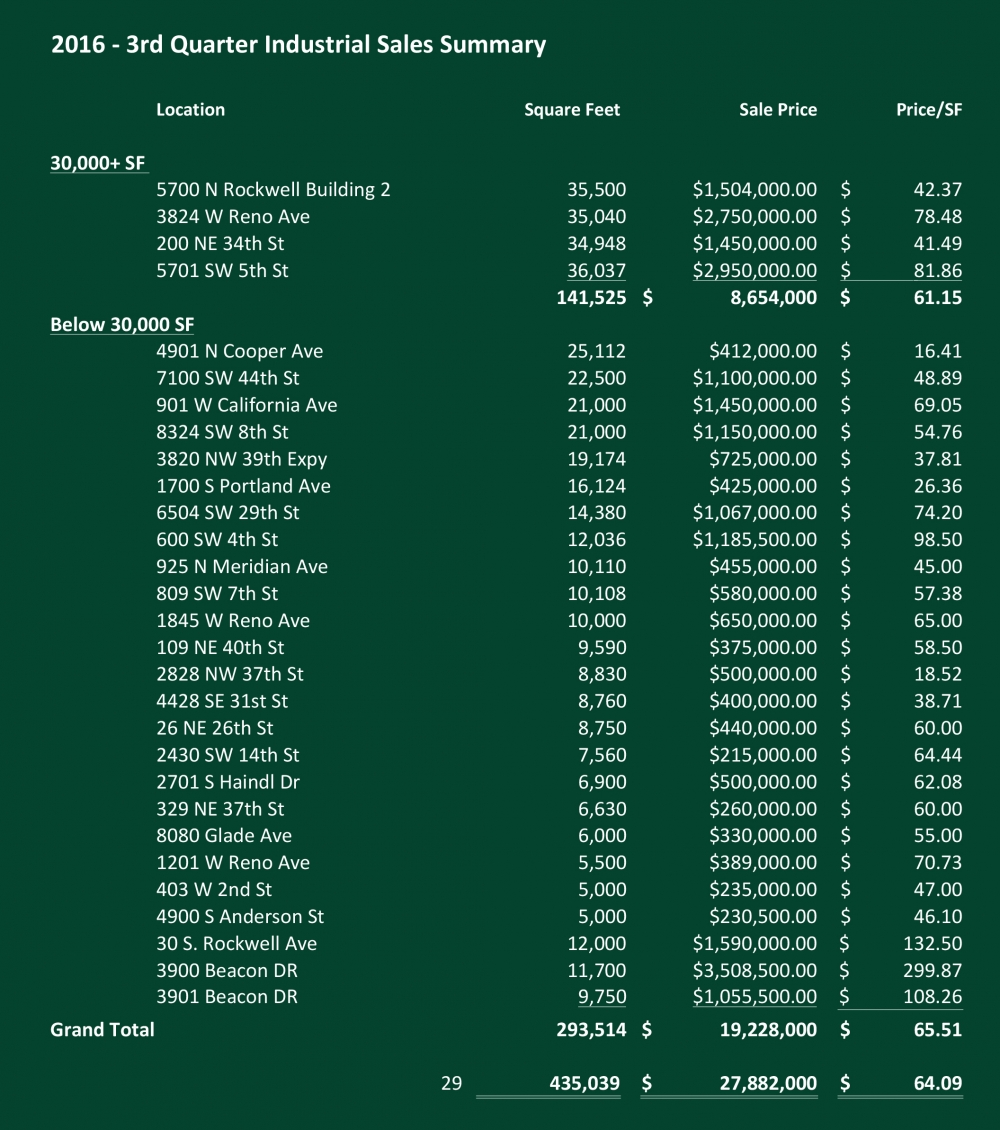
The 3rd quarter of 2016 is continuing to show life with the most recent data compared to the preceding quarter. Overall there were 29 industrial buildings sold containing 435,039 square feet for a total consideration of $27,882,000. The market-wide average price per square foot in the 3rd quarter was $66.40, which is a 64 % increase from the 2nd quarter of 2016. This number is slightly skewed due to three (3) transactions, which were acquisitions via Hobby Lobby for future expansion. Those properties traded for an average of $180.21 PSF and do not accurately reflect the industrial market.
All things considered, the Oklahoma City industrial real estate market is staying consistent. A major contributing factor is the decreasing vacancy rate which has been consistently declining from 7% (4th QTR 2015) to 5.9% through present quarter. A decrease in vacancy, increase in price per square foot and increase of transactions leads to a favorable situation for both Landlords and Sellers. There is a sense that the momentum is going to continue through 2017.
Multifamily Divison

David Dirkschneider
Multifamily Investment Specialist
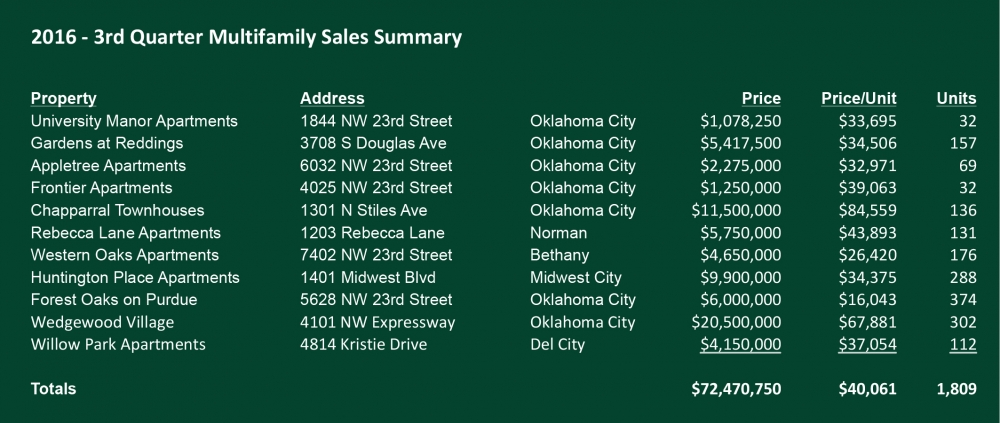
Multifamily Market Sales Slow But Steady
In the third quarter of 2016 the Oklahoma City multifamily market has continued to move forward, albeit at a much slower pace than 2015. Despite losses in oil and gas related industry jobs, Oklahoma City’s economy remains steady as several sectors posted job gains resulting from years of effort to diversify our economy. Hiring in aviation/aerospace, bio-medical, hospitality & entertainment and transportation & logistics are several industries that are allowing Oklahoma City to continue to thrive while the oil and gas industry starts to put the pieces back together after oil prices were depressed for an extended period. Although oil pricing has been improving, ranging from $40 to $50 per barrel, this has caused some adjustment to the labor market since the days of $90 plus per barrel. However, very few would argue that this has been one of the least painful economic downturns in several decades and illustrates Oklahoma City’s new economic resiliency.
The third quarter brought a total of 11 new multifamily transactions involving twenty-five units or more, with a total of 1,809 units being sold for $72,470,750. This equates to an average price per unit paid across all asset classes of $40,061. Year to date volume is $168,589,750, down 30% from 2015, with a total of 25 transactions comprised of 3,983 units; making the average price per unit $42,327, down only 9.36% from 2015. A decrease in sales volume compared to 2015 was expected as last year’s transactions reached historic levels. However, we are right in line with the ten-year averages of $165 million in volume and 4,030 units (through the 3rd quarter for each year) showing that Oklahoma City remains a very healthy and stable market for apartment investment.
Breaking down the transactions by class, there remains very little activity in the Class A market, with the only 2016 transaction closing in the second quarter. There was one Class B transaction this quarter totaling $20,500,000 containing 302 units, an average price per unit of $67,881. As usual, Class C had the most activity with ten properties trading hands, a staggering 150% increase from the previous quarter, providing a total sales volume of $51,970,750. In the third quarter alone, the Class C transaction volume represented 51% of the YTD total Class C volume. These ten properties accounted for 1,507 units, giving Class C assets an average price per unit of $34,486. There were no Class D transactions in the third quarter, leaving the YTD total with the sole 160 unit transaction for $650,000, or just over $4,000 per unit; however, it should be noted the property that was completely empty, and had been shut down for many years.
At the beginning of 2016, rents and occupancy rates started off higher with some downward pressure during the middle of the year. At the end of 2015 and early into 2016, occupancy dropped by approximately 1.5% - 2% percent, never reaching above 91% in 2016. Rents also remained stagnant, albeit didn’t decline like the occupancy rates did, but are starting to head back in a positive direction again. One of the main culprits for this softening in the rental market was the significant number of units delivered. There will be a total of close to six thousand units placed into the market between 2014 and the end of 2016.
Over the last three years the market has absorbed new units at an average rate of 96 units per month, compared to average deliveries of 165 per month, thereby resulting in negative absorption during the period. This in turn has caused some pressure on owners to reduce their rents after seeing their occupancy suffer, or even offer concessions. The hardest hit areas were along I-35 in Moore, near Quail Springs Mall, and starting to feel the pressure is the Urban Core. Market wide the average concession value has been just under $50 per month per unit, which represents approximately 4% of the leases total income. It is important to note, that these concessions are more prevalent in the newer, luxurious properties, as well as the older distressed properties because those are the two that are having the most leasing challenges.
So far in 2016 we have completed approximately 1,500 units, with some new projects that should be open before the end of the year. This will bring Oklahoma City’s estimated construction deliveries to 2,663. The two making the biggest impact on the Urban Core are Metropolitian and Lift, both Class A luxury communities that started leasing within months of each other. As such, this sub-market is one which bears close monitoring.