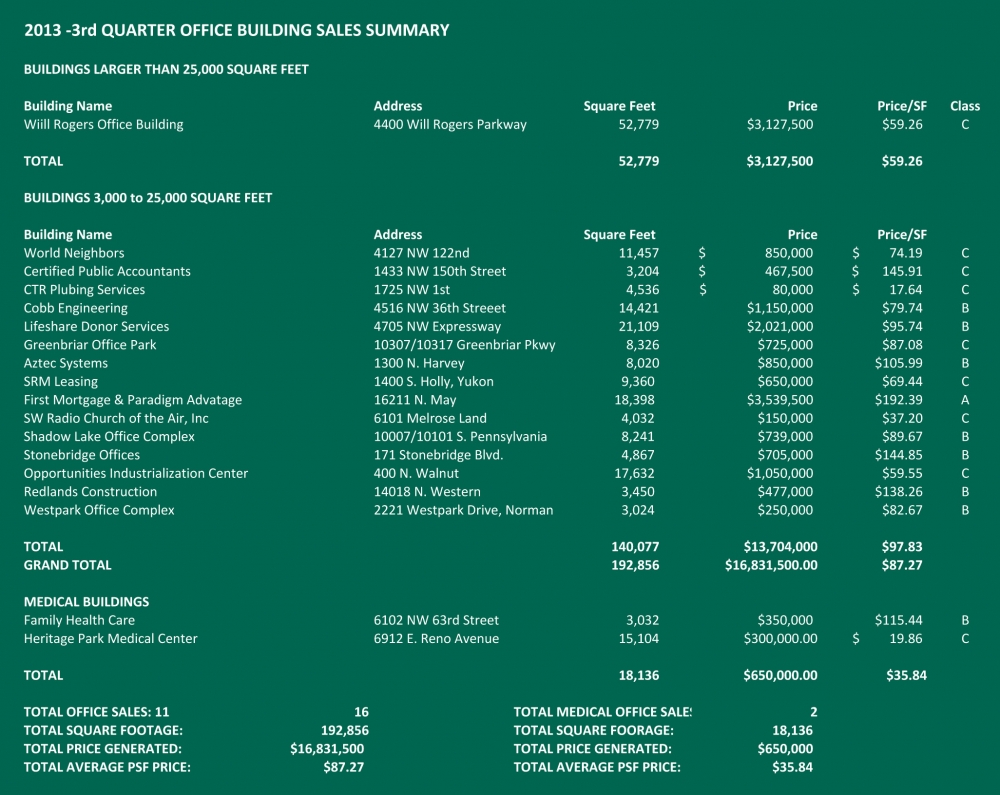
Third Quarter Office Sales Exceed $16,000,000
The Third Quarter Office sales activity of 2013 contained some significant differences in both categories tracked for this report when compared to the 1st and 2nd Quarter sales. A total of 16 properties ranging in size from 3,024 square feet to 52,779 square feet were sold. Total square footage was 192,856 square feet and total dollar volume was $16,831,500, which equated to an average price of $87.27 per square foot. This compares to 11 properties in the 2nd quarter of 2013 containing a total of 445,504 square feet and total dollar volume of $29,696,430 with an average price of $66.66 per square foot.
Only one property in excess of 25,000 square feet sold in the 3rd Quarter. This compared to the sale of 15 buildings containing less than 25,000 square feet. Once again the sale of Class “C” buildings, some at less than $20 per square foot, impacted the averages. As these assets are renovated and move up to Class “B” status, we will see a positive effect on the market.
Two medical properties sold during the quarter. One sold for $115.44 per square foot and the other for an unbelievable $19.86 per square foot.
The anticipated sale of another 300,000 to 400,000 square feet of large assets in the third quarter did not materialize but those properties remain in the Due Diligence stages and there should be some significant sale of larger office properties in the fourth quarter. Additional large asset properties are under negotiation or in the early stages of Letters of Intent.
All in all it appears that the office market in Oklahoma City will continue to be active in the fourth quarter of 2013. Investors, users or a combination of user buyers who are willing to take on more square footage than they require are actively searching the market for properties that meet their needs.
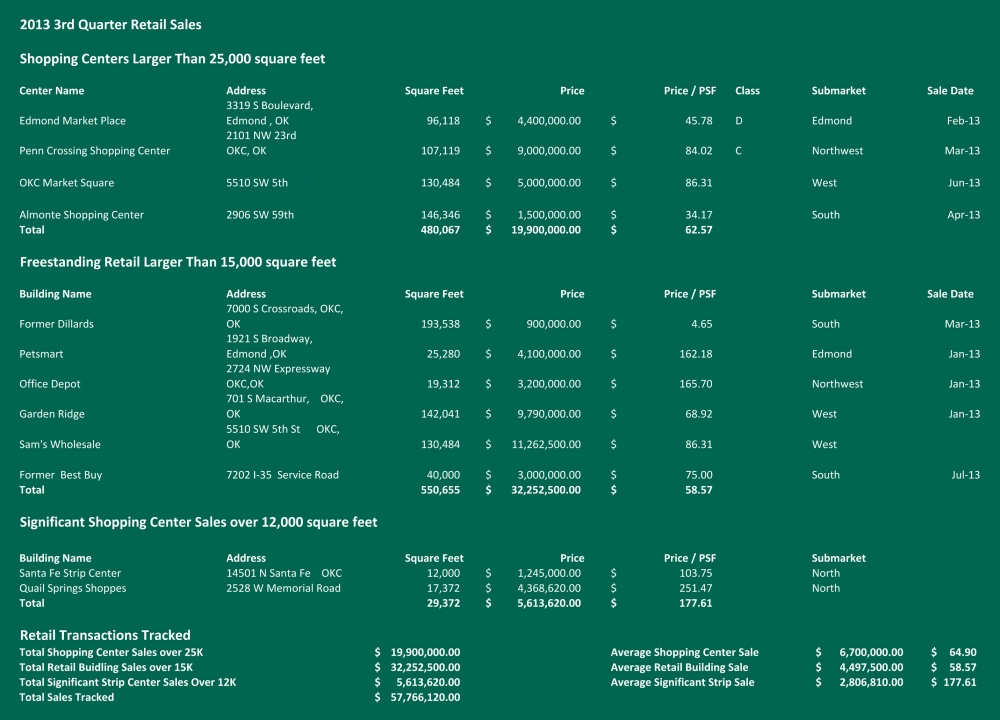
Third Quarter Sees Sluggish Retail Sales
There were no sales of retail buildings of over 25,000 square feet in the third quarter. This is a continuation of a trend of sluggish sales with only four sales year-to-date totaling 480,067 square feet. Three of these sales were distressed centers, leaving only one sale for the year of a market occupied retail center. There are a couple of properties under contract that may close by year-end, but there will be no significant increase in sales. Since the beginning of the downturn in 2008, the sale of retail properties has been the most hard hit sector of the real estate market. As you’ll recall, there were no retail sales of over 25,000 square feet in 2009. And, since then, sales have either been well-located class A centers, with Inland being the principal buyer, or distressed property sales. There have been only a handful of sales in the middle of the market over the past five years. We see a number of buyers who have interest in retail, but, as noted in previous reports, we attribute the lack of available product primarily to limited investment alternatives for sellers. The retail market is good and owners are generally making good returns; if they sell, where do they invest their proceeds and get a similar return? Another contributing factor is capital markets; the availability of financing is getting better, but retail remains the least preferred sector. Overall, we see continued slow investment sales for the near-term with incremental improvement over the next few years.
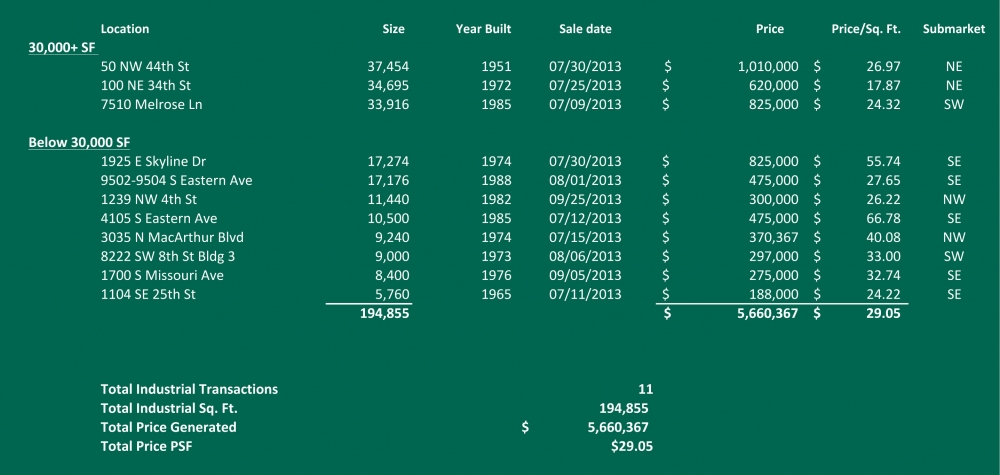
Industrial Sales Reach $5.7 Million in Third Quarter
Industrial sales during the third quarter of 2013 consisted of only 11 transactions totaling 194,855 square feet for $5.7 million, averaging $29.05 per square foot. The average building size was 17,714 square feet. The same quarter in 2012 posted 24 sales, 862,261 square feet for $30.6 million or $35.48 per square foot. The 2012 sales included a 338,000 square foot investment sale. Three sales in 2013 were over 30,000 square feet, the largest being 37,454 square feet. Users predominated this quarter’s sales, which probably reflects the lack of investment product available rather than economic conditions. The single investor sale over 30,000 square feet was a purchase by a California investor of a bank-owned property with significant deferred maintenance.
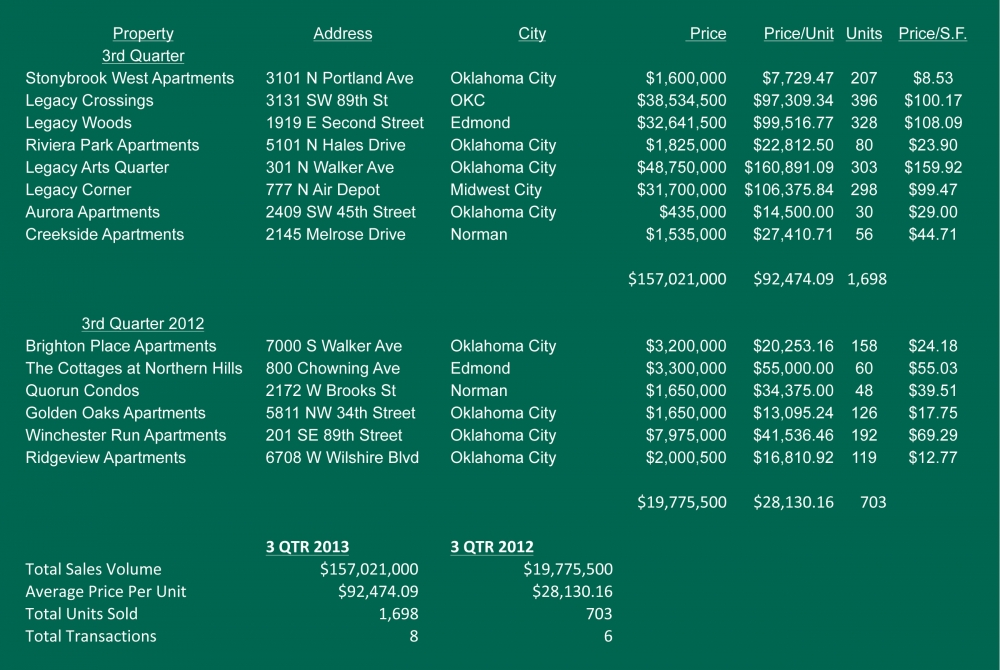
Multifamily Sales Reach $157,000,000 in Third Quarter of 2013Multifamily
In the third quarter of 2013, the Oklahoma City multifamily market had a total of eight transactions comprised of 1,698 units, and sales volume of $157,021,000. This is an average sales price of $92,474 per unit. The third quarter had a total sales volume higher than the first and second quarter of 2013 combined, bringing the total annual sales volume to $268,871,000 at the end of the third quarter. This is mainly attributed to a large portfolio sale of the Class A Legacy Apartments portfolio which was $151,626,000 between four properties.
So far in 2013, Class A properties have received most of the spotlight for their total sales volume; however, even with their high dollar amount the total volume is only up 12.76% compared to the same time last year. When you compare this to the impressive increase of 165% in C Class transaction volume, it’s evident that there is more increased interest in this asset class than the others. By the end of the third quarter in 2013, Class C properties had a total of 1,903 units change hands for the year, with an average sales price of $22,819 per unit and a total sales volume of $43,425,000. The average price per unit is up 5.7% compared to the average price per unit during the same period of 2012 at $21,595. This is an average of C Class overall, not segregated by performing and non-performing assets. When non-performing assets are removed, C Class transactions had an average price per unit of $25,911 which is also up 9.7% compared to the same time last year. There were no Class B or D properties traded during the third quarter of 2013.
Overall, the data shows the market is continuing to improve at a strong pace and for the near future it doesn’t appear to be slowing down. New construction is reporting record lease-up times indicating a pent up demand for multifamily housing in all parts of the MSA. With some of the deals floating around in the pipelines, it’s also very possible that 2013 will have the highest sales volume in the last decade.
Going forward, the only way to continue on this astounding pace is for the C Class properties to continue to improve and transact, but more importantly for the large volume Class A properties to sell. With the large number of units in the construction pipeline and those that are recently completed and now fully leased, it’s very possible for those properties to be sold within one to two years after completion and continue setting record breaking sales prices. An encouraging point is that with the combination of investor demand, bankers’ willingness to start originating loans again, and the dwindling pool of distressed assets, the prices are feeling pressure to trend upwards. As prices trend up, owners will become sellers once again, and more buyers will return to the market. Therefore we remain bullish on the overall health of the multifamily investment market and expect to see this trend going into the next couple years.