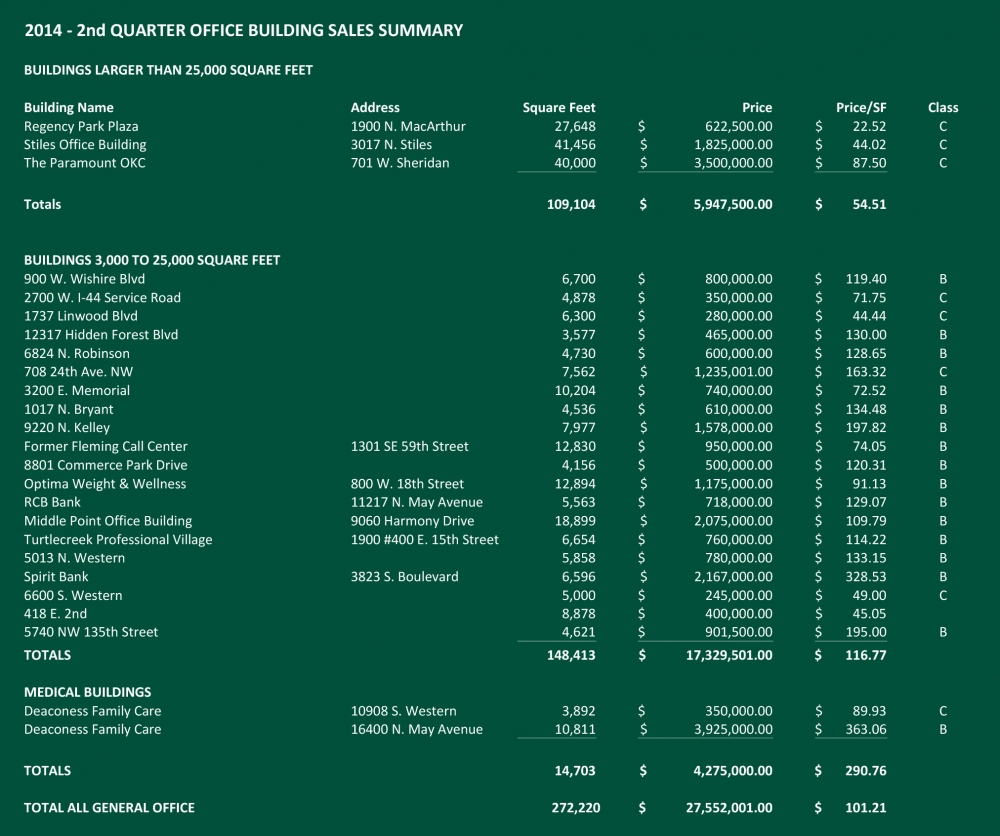
Small Building Sales Are Strong Component in OKC Office Market
The 2nd Quarter of 2014 was similar to the 1st Quarter in the number of transactions. However, there was quite a significant difference in comparison to the 1st Quarter in both total square footage and dollar volume. The 1st Quarter had sales of five buildings in excess of 25,000 square feet with total square footage of 331,764 square feet and a total dollar volume of $39,091,192 averaging $117.83 per square foot. By contrast the 2nd Quarter had sales of three buildings totaling 109,104 square feet and an average price of $54.51 per square foot totaling $5,947,500 The price range per square foot in the 2nd Quarter, with the low price per square foot being $22.52 and the high being $87.50, was far greater than the range in the 1st Quarter. Further, the second quarter sales were all Class “C” buildings and were all sold to local investors.
Small office building sales continue to be a very strong component in the overall sales volume for office buildings. The 2nd Quarter saw the sale of 20 buildings in the tracking range between 3,000 and 25,000 square feet. This compared to 17 sales in the 1st Quarter. Total dollar volume for the smaller properties in the 2nd Quarter was $17,329,501 with an average price per square foot of $116.77. This compared to the total dollar volume in the 1st Quarter of $11,803,485.34 and an average price of $102.51 per square foot.
All in all, the Oklahoma City office market continues to show excellent strength and resilience. It will be interesting to see if First National Center brings the kind of pricing the current owners are looking for. It is also expected that another notable downtown property will change hands.
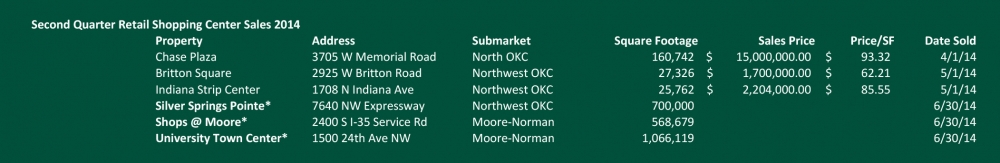
Retail Market Sees Significant Sales in Second Quarter
Second quarter retail investment sales were significant due to Kite Properties national acquisition of the Inland Diversified portfolio which included three local properties: Silver Springs Crossing, Shops at Moore & University North Park. The overall transaction was a $2.1 billion dollar stock transaction, the largest ever for Kite, doubling its size. Given the nature of the transaction, the value assigned to the local properties will not be known for some time. And while the Oklahoma City properties did not drive this transaction, the amount of institutional interest in our market continues to increase, driving down capitalization rates for our best properties. We are aware of two pending sales of large class A projects that should be completed in the third quarter by large national buyers for which there were multiple bidders. The biggest issue going forward for these institutional buyers is lack of available product. In fact, in all product types, we are seeing significantly more interest from buyers than sellers. We still attribute much of this lack of sellers to limited attractive investment alternatives. Despite this increased demand, we do not see a flood of product on the market, though we do expect a further uptick in sales. The primary beneficiaries will be class A and near class A product. The lower-end market is expected to remain active as well. And, while the market has seen a few sales in mid-market product, we anticipate that this broad category will continue to lag in sales volume. With regard to the 2nd Quarter sales, it should be noted that Chase Plaza is at this point primarily an office park with a limited retail component.
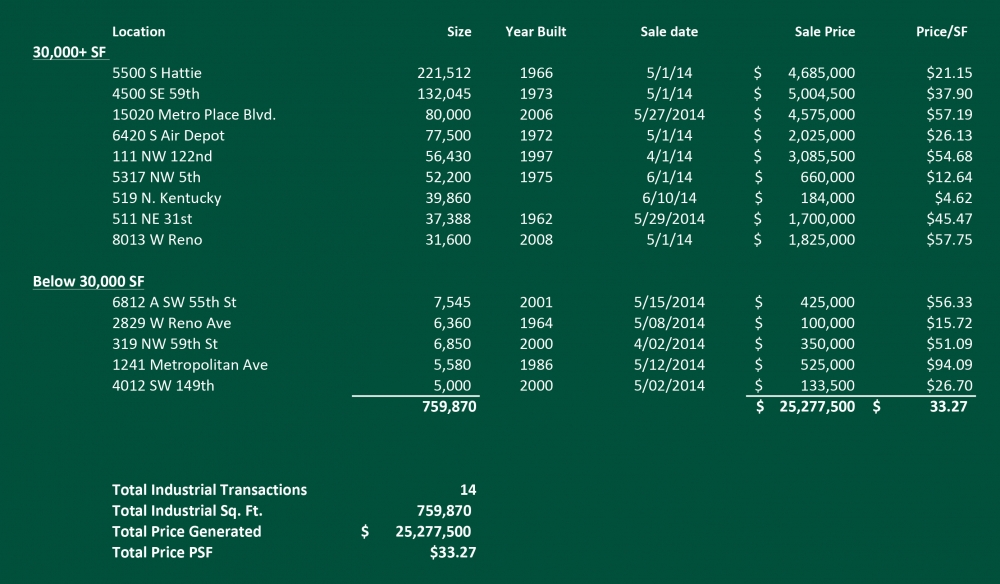
Industrial Market Sales Reach $25.2 in Second Quarter
Industrial building sales during the second quarter of 2014 were dominated by the sales of buildings over 30,000 square feet to both users and investors. Nine large building sales occurred transacting 728,535 square feet for $23.7 million. The largest was 5500 S. Hattie, a 221,512 square foot manufacturing facility sold as a part of a business unit sale. Although the real estate was never openly marketed, the sale price was well within the market price range for this type of building if vacant. This sale was the only large sale to an out-of-state investor. A total of fourteen sales represented 759,870 square feet with an average size 54,276 square feet and a total consideration of $25.27 million. The average per square foot price was $33.27. In contrast, the 2nd quarter of 2013 recorded 32 sales totaling 662,842 square feet for just over $22 million and was dominated by small building sales.
The market continues to forge ahead. The only limiting factor for the remainder of 2014 will be the availability of quality space available for sale. Sales prices will continue a moderate, steady increase.
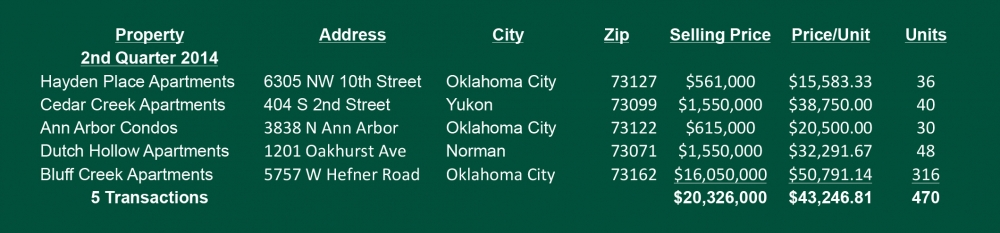
Multifamily Market Builds Momentum
Although 2014 started out fairly slowly, the momentum seems to be mounting as investors have been circling waiting for deals to hit the market. So far the only reason we haven’t seen record-setting transactions is due to the lack of inventory that is accurately priced, as well as a lack of Class A assets trading compared to recent years. In total, the first half of 2014 has experienced just over $100 million in sales volume accounting for 2,587 units. This is 12% under 2013 numbers, but it needs to be kept in mind that 2013 had over $63 million in Class A assets sell which skewed the numbers upward. The question is what type of assets will hit the market, and what are the opportunities? With the exception of a few lingering assets, the truly distressed “value-add” opportunities are largely gone. Although we will likely see a few trade hands in the second half of the year, the majority of the transactions will be stabilized assets trading on actual, not proforma, income.
Over the last five years we’ve seen a larger volume of Class A sales, and considering the Class A inventory represents a small portion of the overall inventory, there are few options left that haven’t traded in recent years. Most Class A buyers are waiting on new deliveries to the market, while some are opting to look into Class B assets with potential for upgrade opportunities. So far the first half of 2014 saw 1,974 Class B units trade, which is a dramatic increase over the same time period last year. This is slightly skewed due to an off-market portfolio sales accounting for 1,658 units, however, it is a good representation for the demand we see for this type of asset.
Although Class C asset sales are down almost 52% with a total volume of just under $20 million for 2014, this asset class along with the Class B seem to be positioned for the most activity going into the second half of the year. Currently, Class C properties are trading at pre-recession numbers averaging $31,000 per unit so far this year. That represents a 36% increase from the same time period last year. We’re seeing an increase in out of state investment activity, and finally seeing current owners who are willing to entertain offers knowing that all the right indicators seem to be in line with strong pricing. Although the prices are higher than recent years, they are far from being overpriced as investors are basing their prices and asset valuations on current actual income, and not unrealistic projections.
Going forward we expect the activity to increase and prices to continue pushing upwards. Although Class A assets are in a position to be competitively bid, we won’t likely see as many trades this year as the last two years simply because of lack of supply. The leaders will be Classes B and C with a few distressed assets trading towards the end of the year. The key to keeping this market healthy and not over inflating will be if buyers can keep from bidding prices up where they rely on projected numbers to justify the investment.