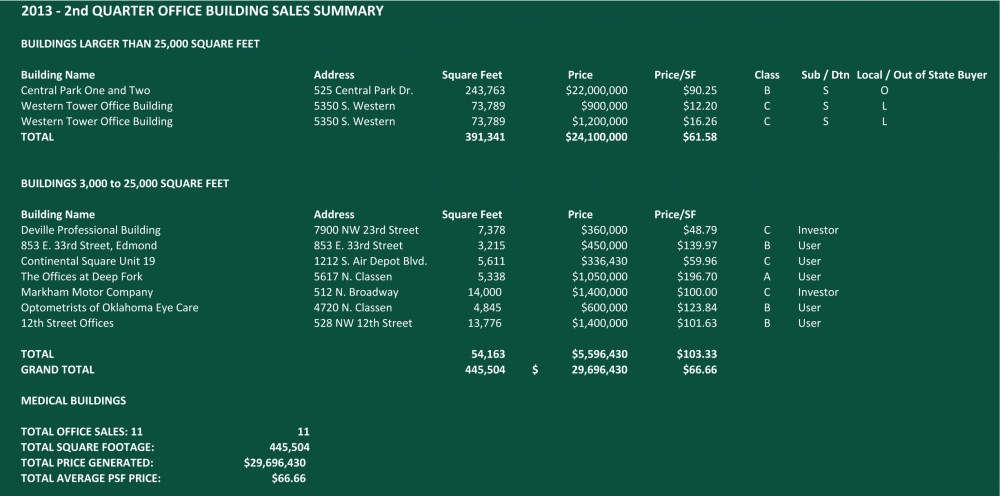
Office Sales Exceed $29,000,000
The second quarter Office sales activity of 2013 was approximately the same as the first quarter. A total of 10 properties ranging in size from 3,215 square feet to 243,763 square feet were sold. Total square footage was 445,504 and total dollar volume was $29,696,430, which equated to an average price of $66.66 per square foot. This compares to 11 properties in the 1st quarter of 2013 containing a total of 434,485 square feet and total dollar volume of $48,992,000 with an average price of $112.76 per square foot.
One of the differences in the second quarter is the obvious drag on the average price per square foot brought on by the sale of Class “C” assets. In the second quarter, this Class “C” effect was witnessed in the category of assets exceeding 25,000 square feet. In this category, the sale of Central Park One and Two totaling 243,763 square feet for $90.25 per square foot was averaged down by the sale of the Western Tower Office Building twice in less than ten days. One sale of this 73,789 square foot asset for $12.20 per square foot and the second sale for $16.26 per square foot brought the average sale price for large assets to $61.58 per square foot. This Class “C” effect was not as noticeable in smaller buildings ranging from 3,000 square feet to 25,000 square feet where the average sales price was $103.33 per square foot. Still, the numbers are reflected in the total dollar volume of sales.
We anticipate the sale of another 300,000 to 400,000 square feet of large assets in the third quarter that is currently under contract or in due diligence. Additional large asset properties are under negotiation or in the early stages of Letters of Intent.
All in all, it appears that the office market in Oklahoma City will continue to be active in the remaining two quarters of 2013. Investors, users or a combination of user-investors who are willing to take on square footage than they require are actively searching the market for properties which meet their long-term needs.
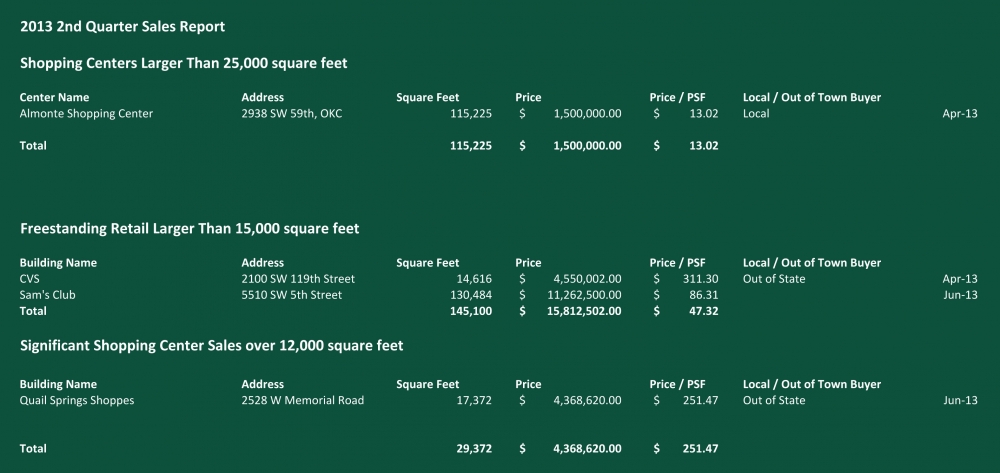
Shopping Center Transactions Remain Slow
The second quarter of 2013 only saw one sale of a shopping center over 25,000 square feet and that was a distressed center sale, Almonte Square at a price of just over $13 per square foot. Following only two sales in the first quarter, Edmond Marketplace (another distressed property sale) and Penn Crossing, little can be ascertained regarding trends and/or the direction of the market other than the retail investment sales market is slow, particularly for mainstream properties.
We attribute the lack of sales to two primary factors: one, the continued inability of sellers to replace returns; and, two, bank underwriting remains conservative, especially for deals with any risk. There are many more buyers in the market than sellers. We’ve listed some of the significant big box and smaller strip center sales as those markets have been more active. We anticipate continued sluggish sales for the remainder of the year with the recent run-up in interest rates also being a contributing factor.
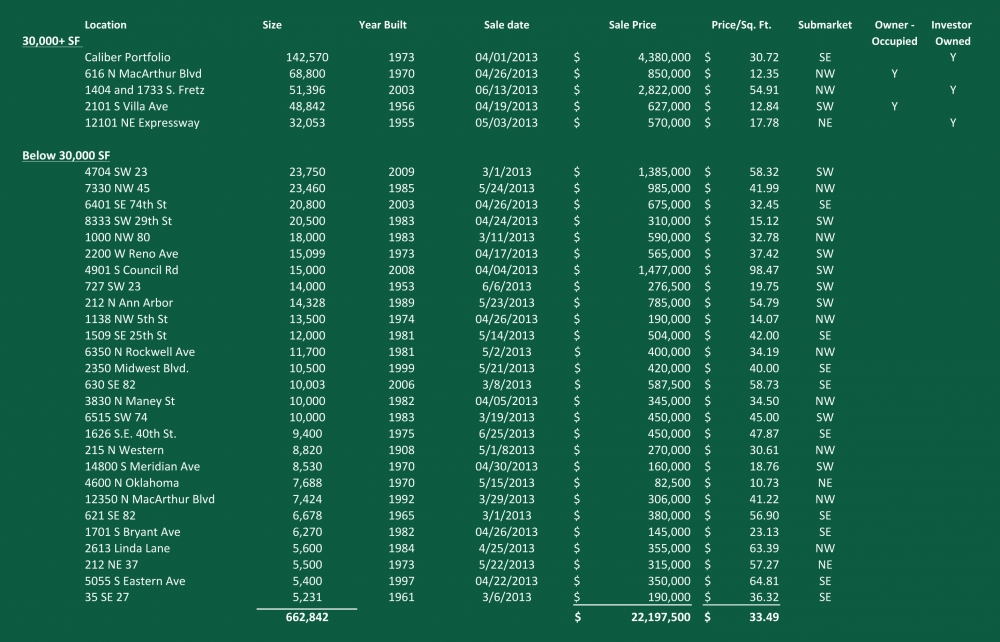
Second Quarter of 2013 Yields Over 600,000 SF in Industrial Sales
Second quarter 2013 industrial sales numbered 32 transactions involving 662,842 square feet for $22.2 million, averaging $33.49 per square foot. The average building size was 20,713 square feet. The second quarter of 2012 recorded 31 sales, 975,711square feet, averaging 31,474 square feet, for $29.37 million, averaging $30.11 per square foot. Second quarter 2013 sales tended towards smaller buildings with four sales over $1 million, five sales over 30,000 square feet, and only one sale over 100,000 square feet. Of the sales over 30,000 square feet, investors bought more square footage than users. The only purchase by a non-Oklahoma investor was a 142,750 square foot long-term net-leased single tenant property.
Second Quarter of 2013 Sees Over $42,000,000 in Sales
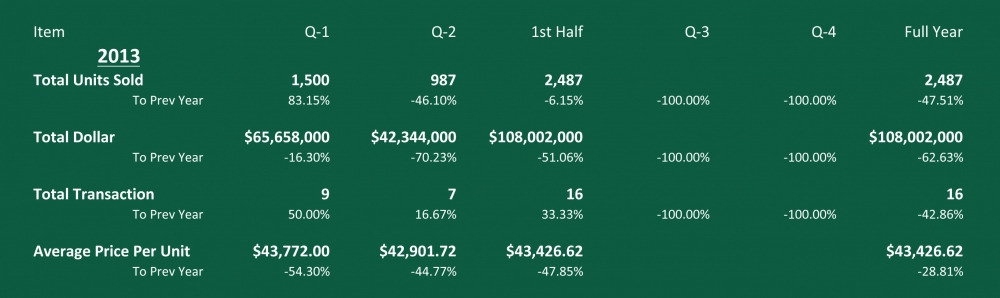
In the second quarter of 2013, the Oklahoma City multifamily market had a total of seven transactions totaling $42,344,000 with an average price per unit of $42,902. This accounts for 978 units sold which is down by 34% compared to the first quarter of the year. When comparing the second quarter of 2013 to the second quarter of 2012 the total unit count was down by 46% from the 1,831 units sold in Q2-2012 and a decrease of 70% in total sales volume from the $142,239,000 sold in Q2-2012. However, these numbers can be slightly misleading as transaction volume can be easily steered one way or another based on what particular month a transaction closes in that given year. One quarter can experience two Class A transactions and have none in another which would drastically change averages and/or totals.
A better representation of the market’s overall health is a comparison between the first half of 2012 and the first half of 2013. In the first half of 2013 transactional activity has remained strong as projected in our annual forecast. A quick recap the first half of 2013 shows that total multifamily sales volume in Oklahoma City was just over $108 million, a 51% decline from the same period of 2012; however, a total of 2,487 total units sold in this period, which was only a 6% decline from last year. The primary reason for the drastic decrease in the total sales volume is due to the unusually high volume of Class A properties which sold in the first half of 2012. The first half of 2012 saw over $200 million in Class A properties sold compared to only $63.5 million in 2013.
2013 had a decrease of 86% in Class B transactions from last year, with 2013 having only $6.6 million in Class B sales as compared to $45.6 million in 2012.
Class C assets were the only category to experience an uptick, with the number of transactions, total dollar volume, number of transactions, and average price per unit all gaining ground.
The first half of the year saw only a single closing of a Class D property
Overall, the transaction data seem to be forecasting a slowdown compared to last year; however with the exception of 2012 this year’s transaction volume is the highest volume since 2008, and almost double the annual average for this time period. 2012 was an exceptional year for Class A transactions with those properties able to find financing easier. Going forward, the Class C market seems to beginning to find momentum that hasn’t been seen since the recession began. We expect transaction volume to remain strong and as long as interest rates remain low investors will continue to make up for the deals lost in the previous five years.
The most encouraging data point for investors is that all multifamily asset classes experienced increases in the average price per unit. This should provide solid evidence that Oklahoma City continues to be an appreciating market. As such, it is expected more outside investors, both individual and institutional will continue to consider the local market for allocations of real estate capital.