Office Division

Cordell Brown, CCIM, CIPS
Office Investment Specialist
Q4 2016 Office Sales See High Square Footage, Low Sales Dollars
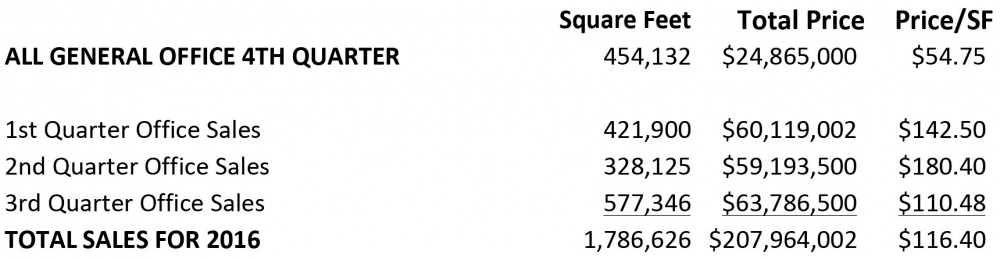
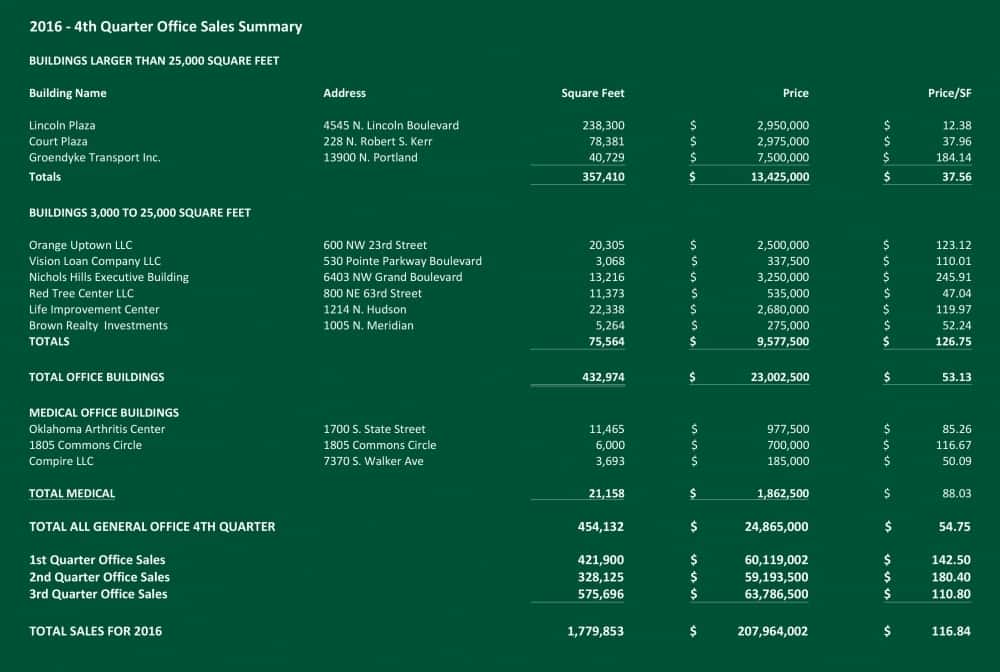
The 4th Quarter of 2016 could turn out to be a bit of an anomaly for the office market in Oklahoma City. It was the second highest quarter of the year for square footage of office buildings sold and it was the lowest quarter for total sales dollars and price per square foot of office buildings sold. Consequently, it dragged down the numbers for the three preceding quarters. Total sales for the quarter were twelve buildings containing a total of 454,132 square feet with a total price of $24,865,000 or $54.75 per square foot.
The statistical culprits in the quarter were the sale of Lincoln Plaza, a 243,423 square foot office complex for $2,950,000 or $12.12 per square foot and the sale of the Court Plaza, a CBD office building containing 78,381 square feet for $2,975,000 or $37.96 square feet. The other sale in the 25,000 square foot or larger category was the Parkway Commons, which brought $7,500,000 or $184.14 for 40,729 square feet.
The sale of the larger buildings was followed up by a very poor showing in the sale of buildings in the 3,000 to 25,000 square foot range. Only six buildings sold in this category for the quarter. The lowest number of buildings and lowest square footage in the category for the entire four quarters. However, with a total of 75,564 square feet and an average of $126.75 per square foot the small buildings had a good showing. The primary reason was the sale of the Nichols Hills Executive Building, which contains 13,216 square feet and sold for $3,250,000 or $245.91 per square foot.
Whether the 4th Quarter was truly an anomaly or an unfortunate sign of a coming trend remains to be seen. That said, the general economy appears to be rebounding nicely with the increase in the all important oil prices and low unemployment as signs of good or better things on the horizon.
Following is a summary of General Office Building Sales for 2016:
Retail Division
Paul Ravencraft, George Williams, Phillip Mazaheri, CCIM
Retail Investment Specialists
Investment Sales Pick Up in Q4 2016
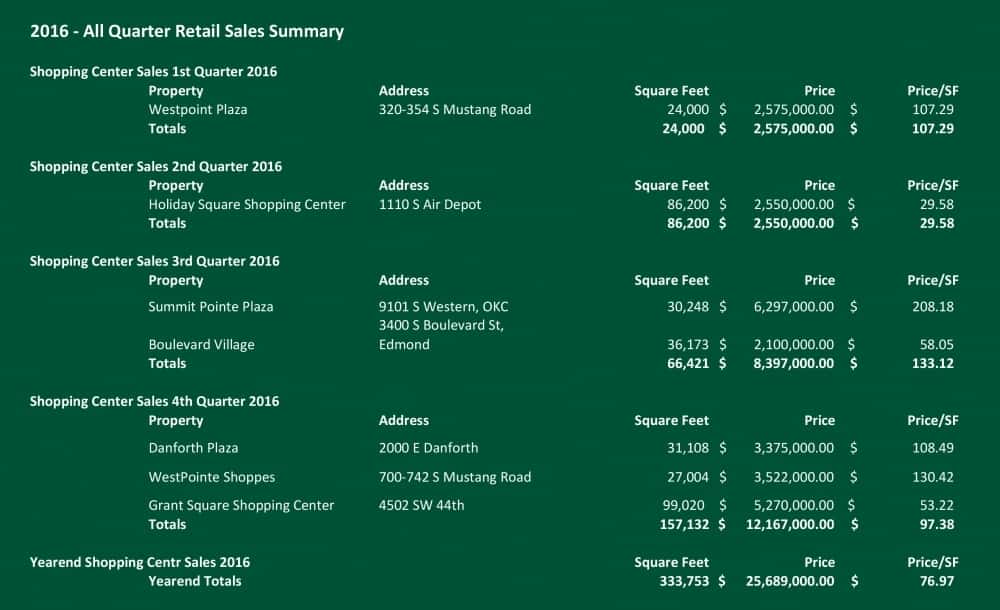
The investment sales market picked up in the fourth quarter of 2016. A total of three centers of over 25,000 square feet were sold in the fourth quarter for a total value of $12.167 million. These three properties totaling 157,132 square feet accounted for 47% of the centers sold in 2016. Two larger Class A properties were marketed for sale in the fourth quarter, but did not close in 2016, Quail Springs Marketplace and 240 Penn Park. While there was significant interest in these properties, many of the institutional buyers who have been active in our market the last several years who have driven down capitalization rates were absent from the bidding. Consequently, if the properties trade, they are expected to trade at a somewhat higher capitalization rate, putting them in play for private national/regional firms as well as local investors.
Industrial Divison

Danny Rivera, Mark Patton, Bob Puckett, Chris Roberts
Industrial Investment Specialists
OKC Industrial Real Estate Market Shows 33% Jump in Total Dollar Volume
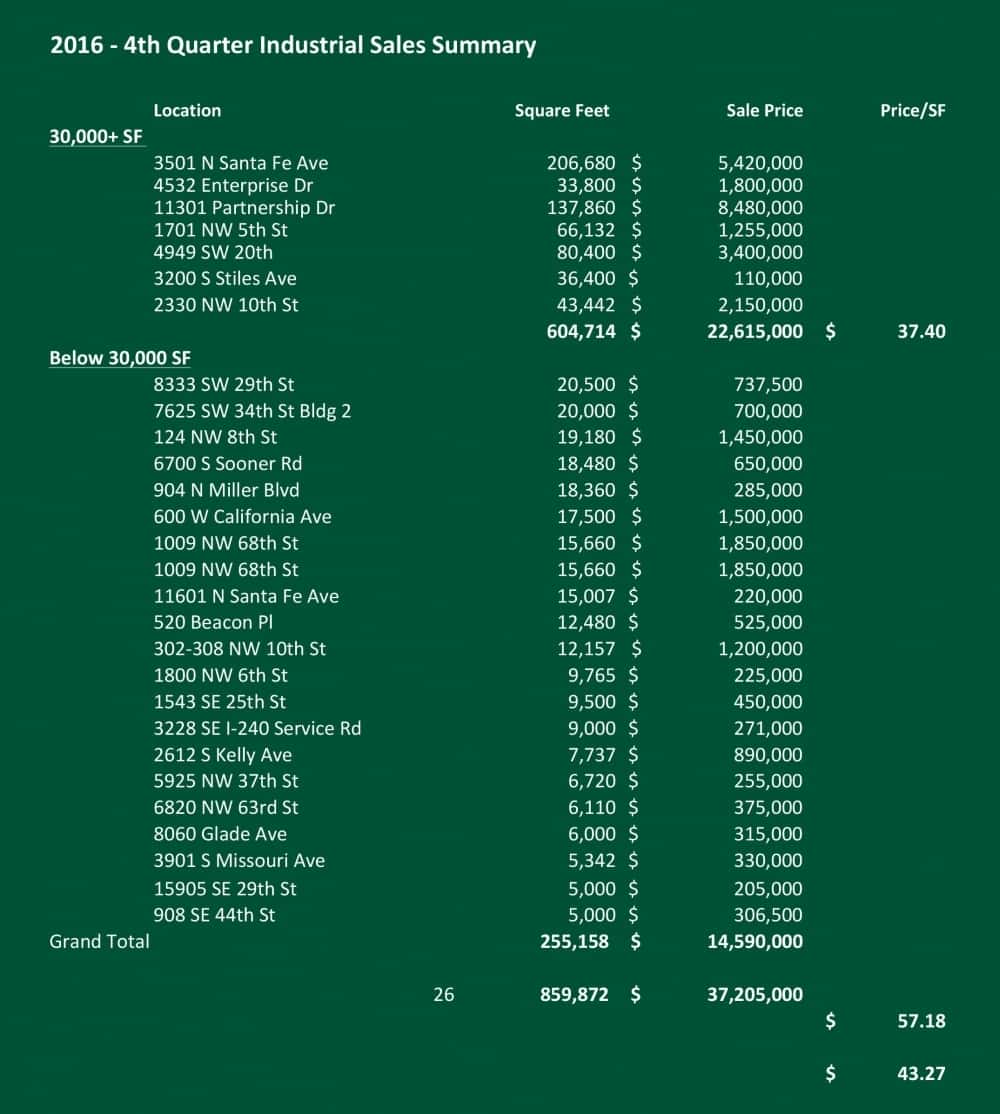
The 4th quarter of 2016 is continuing to trend upwards, compared to the preceding quarter. Overall there were 26 industrial buildings sold containing 859,872 square feet for a total consideration of $37,205,000. The market-wide average price per square foot in the 4th quarter was $44.97 which is a 64% decrease from the 3rd quarter of 2016.
All things considered, the Oklahoma City industrial real estate market showed a 33% jump in total dollar volume. Even though this market is favorable for both Landlords and Sellers, we are seeing some hesitation in tenants to commit to long term leases due to skepticism with overall market conditions.
Multifamily Divison

David Dirkschneider
Multifamily Investment Specialist
Following a Strong Run, Multifamily Sales Slow Down
In the fourth quarter of 2016, the Oklahoma City multifamily market finally started to slow down after a long, strong run. Although job growth is up slightly over the last quarter, the overall employment is still down from the same time last year, and job growth is the number one factor for the multifamily rental industry. Oil prices are now slowly moving back up; this single factor, if continued, could provide a second wind to Oklahoma City’s economy, and in turn create jobs and fuel the housing market even longer. Despite a slight increase in rates, the multifamily investment market still remains strong and investors continue to search for deals, although the search is more difficult than it was just a year ago. Inventory on the market is priced at levels the market has never experienced, and CAP rates have been compressed to historic lows. Despite the low return, multifamily still seems to be a place where commercial real estate investors want to place their capital, and the demand continues pushing prices higher and higher.
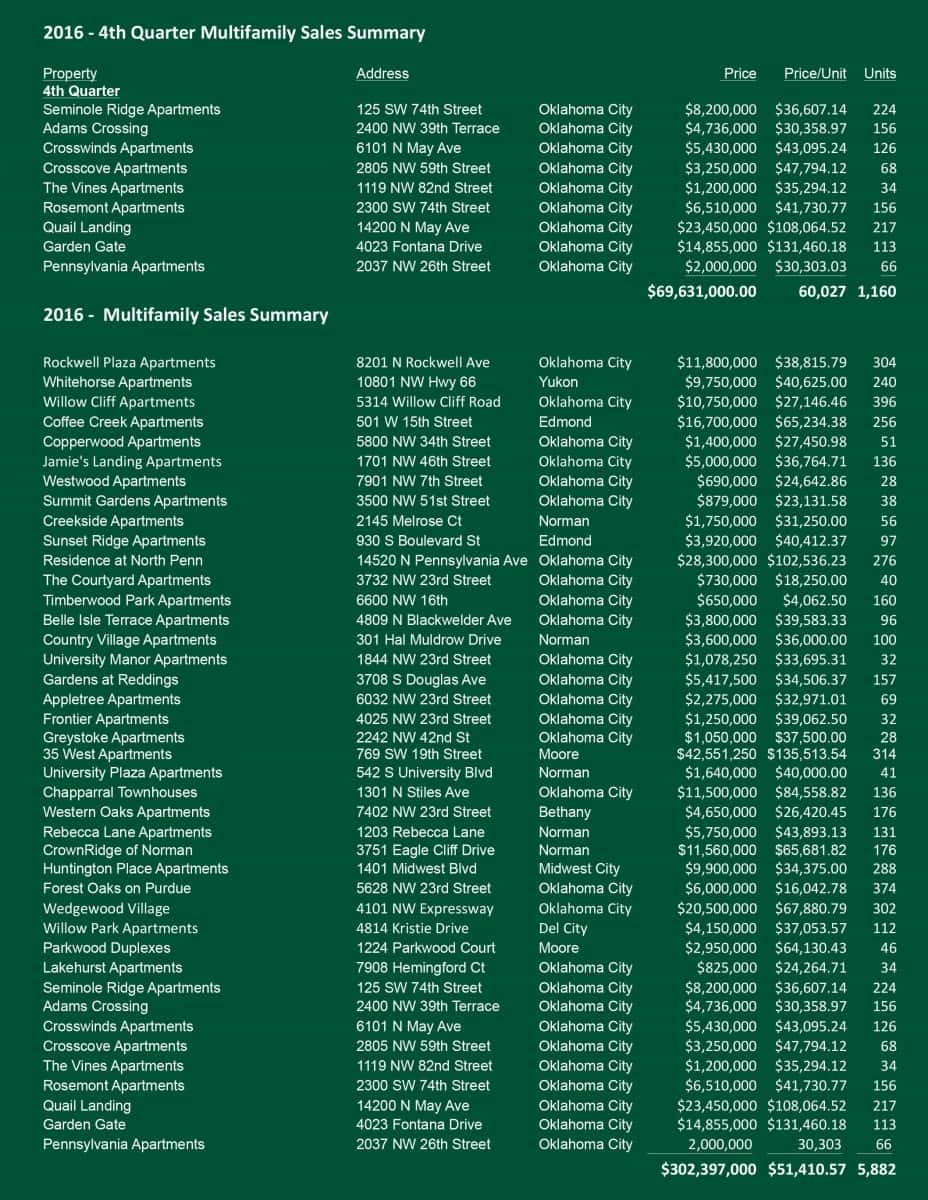
The fourth quarter saw 9 new multifamily transactions, involving twenty-five units or more, with a total of 1,160 units being sold for $69,631,000. This gives an overall average price per unit paid across all asset classes of $51,411. More importantly, adding that to the three prior quarters, the year end volume was down approximately 30% from the previous year at a total of $302,397,000. This gives 2016 a total of 41 transactions consisting of 5,882 units; making an average price per unit of $51,411, up 3.5% from 2015’s average of $49,665. This year over year growth verifies the continued demand in the multifamily sector as investors continue to aggressively pursue purchase opportunities, and push the envelope further on CAP rates and values. The total volume decline from 2015’s was not surprising as 2015 set a historic benchmark for the total multifamily sales volume for not only Oklahoma City, but the United States. Although the volume was down from 2015, the 2016’s average price per unit was still 20% above the ten-year average, indicating there is still continued appreciation in property values.
Breaking transactions down by class, there remains activity in all property classes, with a total of 3 transactions each for Class A and Class B, 34 in Class C, and Class D trails with 1 transaction for the year. All Classes except Class D experienced growth in value with an increase in their price per unit compared to the previous year. Class A had a total transaction volume of $23,450,000 in the fourth quarter, and $94,301,250 for the year. Class B ended the year with $43,115,000, exactly half of the amount as 2015. Not surprisingly, Class C had the most volume for the quarter and the year at $31,326,000 and $164,330,750, respectively. Although this was the most active asset class, this still represented a 16.6% decrease year over year.
One of the most common indicators of market health is the price per unit for Class C assets. 2016 ended with an average price per unit of $37,716 overall, and $39,914 for performing C Class properties. Both overall and performing prices per unit were up 4% from 2015. Class A properties ended the year with an average price per unit of $116,854, up 3.55% from the previous year. Class B also experienced an increase, albeit not as large at just over 1%, bringing the average price per unit paid to $79,110. The overall average price per unit of $51,411 was up 3.5% year over year giving Oklahoma City multifamily investors another year of positive appreciation.
In 2016, there were a total of 3,407 new units added, although the market only absorbed 1,454. This negative absorption decreased the overall average occupancy to 89%, a 2.2% decline from 91% at the end of 2015. The largest decrease was felt in Class A properties, and is likely a result from the continued addition of new supply. This is expected to be a temporary setback, as the market had already increased absorption towards the end of the year; and although there are another 2,200 units planned to be delivered in 2017, this is a trend down from the previous two years.
Despite the increase in vacancy, the market continues to gain value and push forward. The annual value appreciation is consistent and steady even though the years of turbulent occupancy. 2017 brings multiple possible scenarios from job growth spurred by the new administrations infrastructure spending increase, or the continued rise in oil prices. We remain bullish on the Oklahoma City multifamily investment market, and expect 2017 to be very similar to 2016.
For more detailed information on the rental market, such as specific rental rates, occupancies and a further breakdown in transactions for 2016, please see our 2016 Year End Multifamily Survey.